Publications
Shear-wave velocity imaging of weathered granite in La Campana (Chile) from Bayesian inversion of micro-tremor H/V spectral ratios
Authors: Rahmantara Trichandi, Klaus Bauer, Trond Ryberg, Britta Wawerzinek, Jaime Araya Vargas, Friedhelm von Blanckenburg, Charlotte M. Krawczyk
11 October 2023
Subsurface imaging of the regolith layer is an important tool for weathering zone characterization. For example, the extent of bedrock modification by weathering processes can be modelled by means of differing seismic velocities. We acquired a 360 m-long seismic profile in central Chile to characterise weathering at a semi-arid site. We used 87 3-component geophones, which continuously recorded ambient seismic noise for three days. The seismic line was centered at an 88 m deep borehole, providing core and downhole logging data for calibration. We extract Horizontal-to-Vertical Spectral Ratio (HVSR) curves along the seismic line to image the subsurface. Temporal analysis of the HVSR curves shows that the ambient noise vibrations recorded during the nighttime provide more stable HVSR curves. The trans-dimensional Bayesian Markov chain Monte Carlo (McMC) approach was used to invert the micro-tremor HVSR curves at each station to reconstruct 1D shear-wave velocity (Vs) models. The resulting individual 1D Vs models were merged to create a 2D Vs model along the linear seismic array in La Campana. The resulting Vs model shows an increase from 0.85 km/s at the surface to ca. 2.5 km/s at 100 m depth. We use the interface probability as a by-product of the Bayesian inversion to apply a more data-driven approach in identifying the different weathering layers. This method identified the boundary between saprolite and fractured bedrock at 42 m depth at the borehole, as evidenced by the interpretation of downhole logging data such as magnetic susceptibility.

The resulting 2D Vs model of this site in Mediterranean climate shows a strong correlation between the interpreted weathering front at around 90-m depth and a higher precipitation rate in the study site compared to arid sites. The horizontal alignment of the weathering front indicates a correlation between the weathering front depth with topography and fractures in the bedrock.
Read More...Integrating Resistivity And Geochemical Component Data With Bayesian Inference To Characterize Nickel Laterites: A Case Study From Pomalaa Region Using Large-Scale Borehole Data
Authors: Muhammad Arief Wicaksono, Mordekhai, Ardi S Rahmat, Duduk Sumargono
01 October 2023
An integrated approach for characterizing nickel laterites was done using resistivity and geochemical component data with Bayesian inference, based on approximately 63 boreholes. A resistivity anomaly emerges in Bukit XIV Pomalaa area where the limonite layer, which usually correlates with high resistivity zone, also possess low resistivity zone which is used to be the indication of saprolite zone. To analyse this phenomenon, geochemical components of the limonite layer were analysed to see any differences in between the high and low resistivity zone in the limonite layer. Based on the previous analysis in Antam Pomalaa, iron oxide (Fe) affects the resistivity value. This geochemical component and its resistivity value were then analysed using the Bayesian Inference. Based on this approach, it is found that the high resistivity correlates with limonite with Fe > 25%, while the low resistivity limonite possesses Fe < 25%. The result will be used as a new interpretation insight that at certain depth of laterite layer, the low resistivity zone may possess whether a saprolite layer or limonite layer with Fe component less than 25%.
Read More...Mineral Mapping on Hyperspectral Imageries Using Cohesion-based Self Merging Algorithm
Authors: Afnindar Fakhrurrozi, Izzul Qudsi, Mochamad Rifat Noorc, Anggun Mayang Sari
12 December 2022
Recently, hybrid clustering algorithms gained much research attention due to better clustering results and are computationally efficient. Hyperspectral image classification studies should be no exception, including mineral mapping. This study aims to tackle the biggest challenge of mapping the mineralogy of drill core samples, which consumes a lot of time. In this paper, we present the investigation using a hybrid clustering algorithm, cohesion-based self-merging (CSM), for mineral mapping to determine the number and location of minerals that formed the rock. The CSM clustering performance was then compared to its classical counterpart, K-means plus-plus (K-means++). We conducted experiments using hyperspectral images from multiple rock samples to understand how well the clustering algorithm segmented minerals that exist in the rock. The samples in this study contain minerals with identical absorption features in certain locations that increase the complexity. The elbow method and silhouette analysis did not perform well in deciding the optimum cluster size due to slight variance and high dimensionality of the datasets. Thus, iterations to the various numbers of k-clusters and m-subclusters of each rock were performed to get the mineral cluster. Both algorithms were able to distinguish slight variations of absorption features of any mineral. 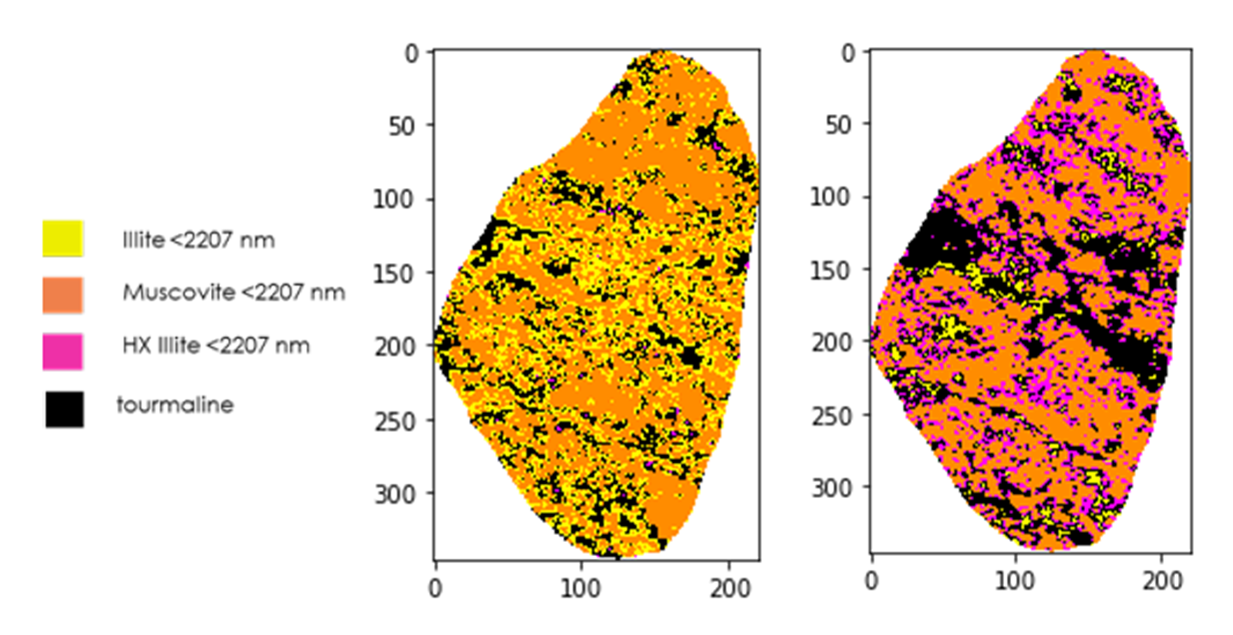 The spectral variation within a single mineral found by our algorithm might be studied further to understand any possible unidentified group of clusters. The spatial consideration of the CSM algorithm induced several misclassified pixels. Hence, the mineral maps produced in this study are not expected to be precisely similar to ground truths.
Ground-Penetrating Radar and Electrical Resistivity Tomography for Nickel Laterite Exploration: A Case Study in North Konawe, Indonesia
Authors: Muhammad A. Wicaksono, Fahriansyah, Mordekhai, Wahyudi W. Parnadi, Ardi S. Rahmat, Yusuf Darnanto, I Gede E. Wardana
10 October 2022
With the increasing demand of batteries for electrical vehicle in world, the interest of nickel laterite exploration and then its exploitation grow significantly. Nickel ore is one of the raw materials for making these batteries, which has high economic values, and is widely found in Indonesia. Therefore, extensive nickel exploration in Indonesia is highly required to obtain the estimation of its potential resources. Until now, data from boreholes near each other are used to calculate Nickel ore resources. To estimate the bedrock depth and horizontal variation between borehole data and therefore reducing operational costs, Ground-Penetrating Radar (GPR) and Electrical Resistivity Tomography (ERT) are the suitable methods for that purpose due to its cost and time effectiveness. In this research, we analyses several GPR profiles acquired with MALA Rough Terrain Antenna (RTA) 25 MHz antennas supported with ERT data in Antam exploration site in North Konawe, Southeast Sulawesi. Radar attributes are assigned after applying conventional processing steps.
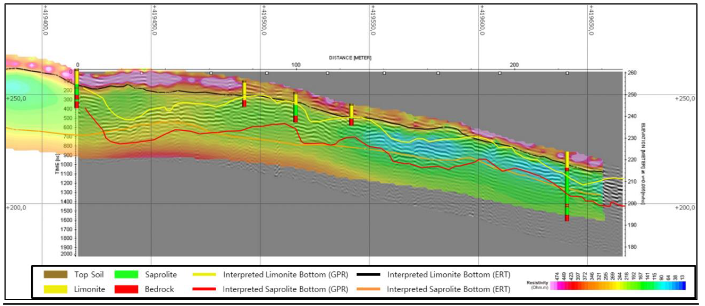 From preliminary results and its comparison with ERT and borehole data as validation tool, we obtained interesting results about the boundaries of limonite, saprolite, and bedrocks.
Geothermal Surface Manifestation Identification Using Airborne Hyperspectral Imagery Case Study: Davis-Schrimpf Geothermal Field, Salton Sea, California
Authors: Izzul Qudsi, Muhammad Rifat Noor
07 February 2022
Research on surface geothermal evidence has been done extensively using remote sensing techniques. For detailed remote sensing exploration on geothermal areas, UAV and airborne based were preferred over the satellite-based sensor. In this research, anomalies in surface temperature, mineral occurrence, and ammonia emission were studied on a set of airborne hyperspectral imagery from NASA, the Hyperspectral Thermal Emission Spectrometer (HyTES). High-resolution surface temperature and mineral maps were able to identify and describe the mineralogy of the mud pots and gryphons at the Davis-Schrimpf Geothermal Field, Salton Sea, California. From the surface temperature map, the surface temperature of the geothermal features wa s measured at approximately 314°K (40 o C) and higher. The purest pixels from MNF transformation of the first four cleanest bands of emissivity map produce endmembers that include the geothermal indicator minerals (barite, anhydrite, quartz, gypsum). Based on the mineralogy deposits, these manifestations are classified as potassic alteration types from a porphyry system that could be an indication of an active geothermal system. This also explains that the surface features are part of the upper reservoir of the Salton Sea Geothermal Field. On the other hand, ammonia detection that was performed in this research failed to get any clear recognition from the simple image processing.
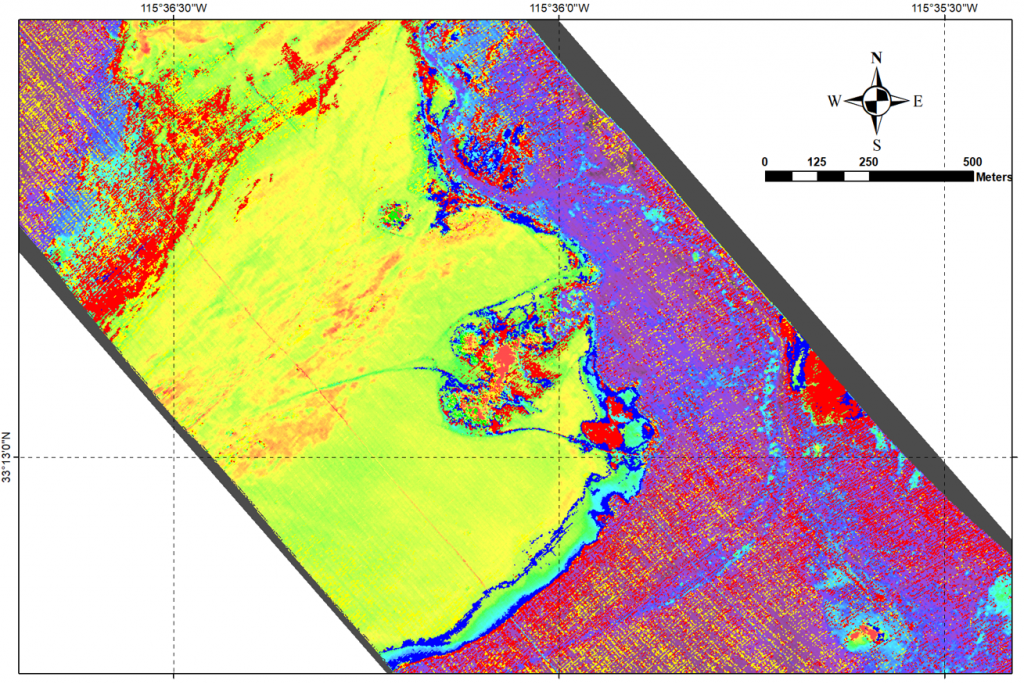
It is concluded that the airborne hyperspectral imagery could be a reliable option for remote sensing geothermal exploration, as it was able to characterize the surface geothermal manifestation with quite good detail using this imagery from a wide area of survey.
Read More...